Data visualization has existed for hundreds of years. It began with maps documenting weather and elevation and has evolved into measuring almost anything you can imagine. Advances in technology let us share all kinds of information in many different ways. Everything from weather maps, like at the origin of data visualization, to graphs of COVID data, is accessed daily and helps thousands of people navigate their lives.
Technological Advances
One of the main benefits of technological advances is that we have more options for how we collect and portray information. Data visualization took off with technological advances because there wasn’t enough data to display before that.
Advanced technology has downfalls as well. With so many ways to display data, many of them apply only to specific scenarios. Displaying data in an ill-fitting manner can be problematic because the audience won’t interpret the correct information. Another challenge is the overwhelming amount of data we have. Advanced technology makes data easier to collect than ever, but having surplus data makes it hard to understand what is essential and what is not.
“Good” Charts
A “good” chart has foundations in relevant data and a format that makes it easy to interpret correctly. As a graphic designer, I believe basic visual design principles are vital to making any format successful in communicating information. These principles include hierarchy, color, value, shape, size, texture, and many others.
I find myself drawn to data visualization that is colorful and easy to understand. My favorites are those which do not use traditional formats such as a bar graph but use creative outlets instead.
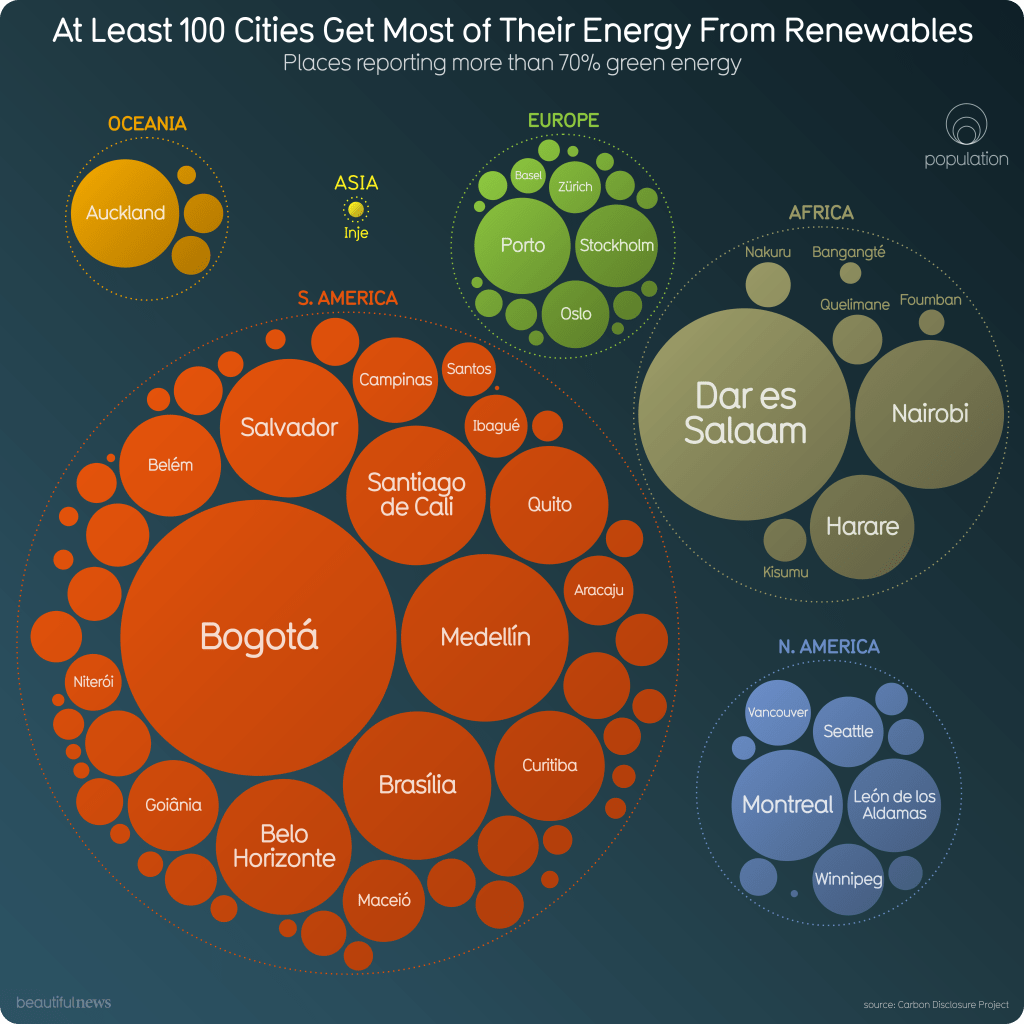
One example of effective data visualization comes from the Carbon Disclosure Project, which showcases cities that get most of their energy from renewable resources. It is colorful and easy to understand due to the hierarchy. The title at the top makes the subject clear, and the subtle key on the upper right side makes it easy to interpret. I particularly enjoy that it shows both the continent and cities, although I would be interested also to see it broken down by country.
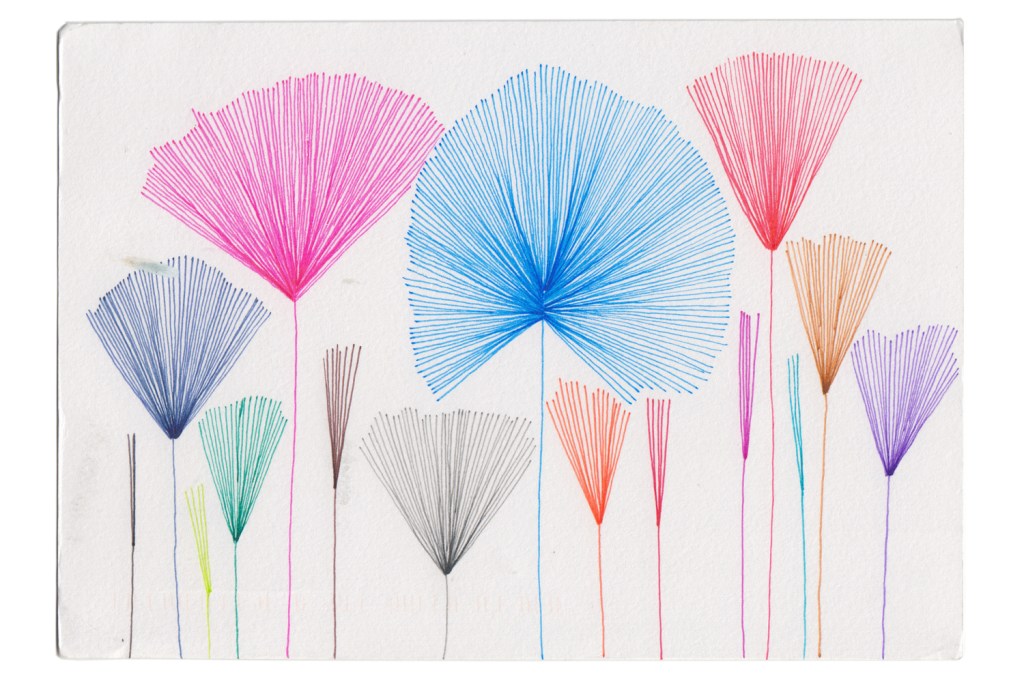
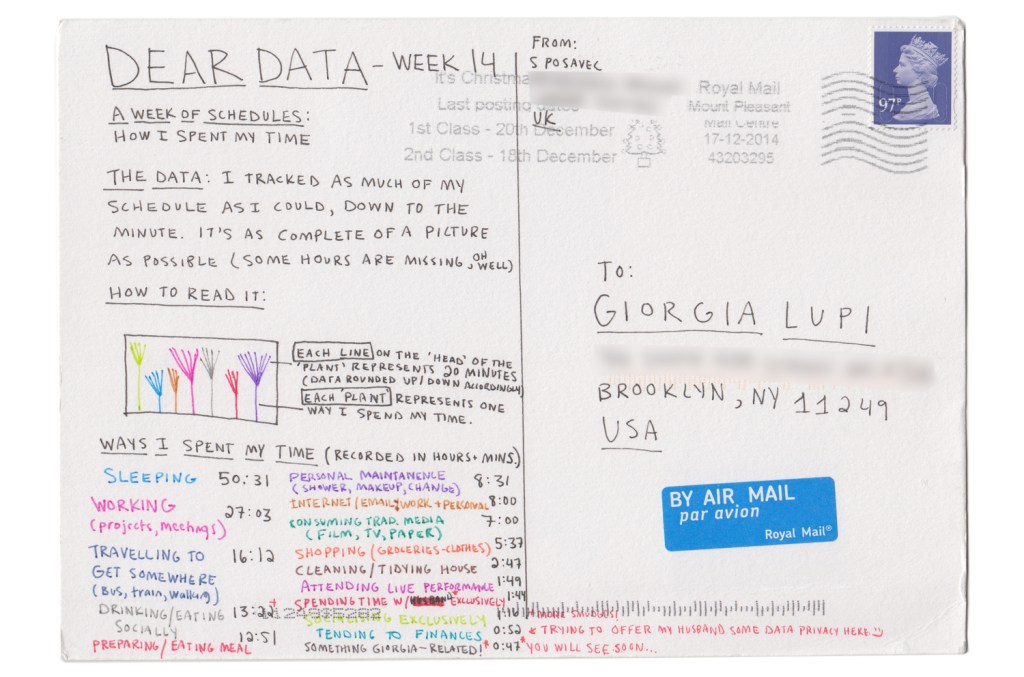
Dear Data also does an excellent job of showcasing creative ways to share data. My favorite is from week 14: a week of schedules. Although I am not particularly interested in Stefanie Posavec’s schedule, how she presented it makes me want to learn more. The colorful leaves drew my eye, and a glance at the back of the card explains what each color means. My only criticism is that some colors are very similar and therefore difficult to tell apart.
I have a soft spot for creativity and love data visualization that takes particularly non-traditional approaches. One of my favorite formats is crochet! I have seen many people track everything from their emotions to climate change via rows in crochet blankets. I like these blankets because they are often very meaningful but can be challenging to understand. For example, the blanket below visualizes climate change.
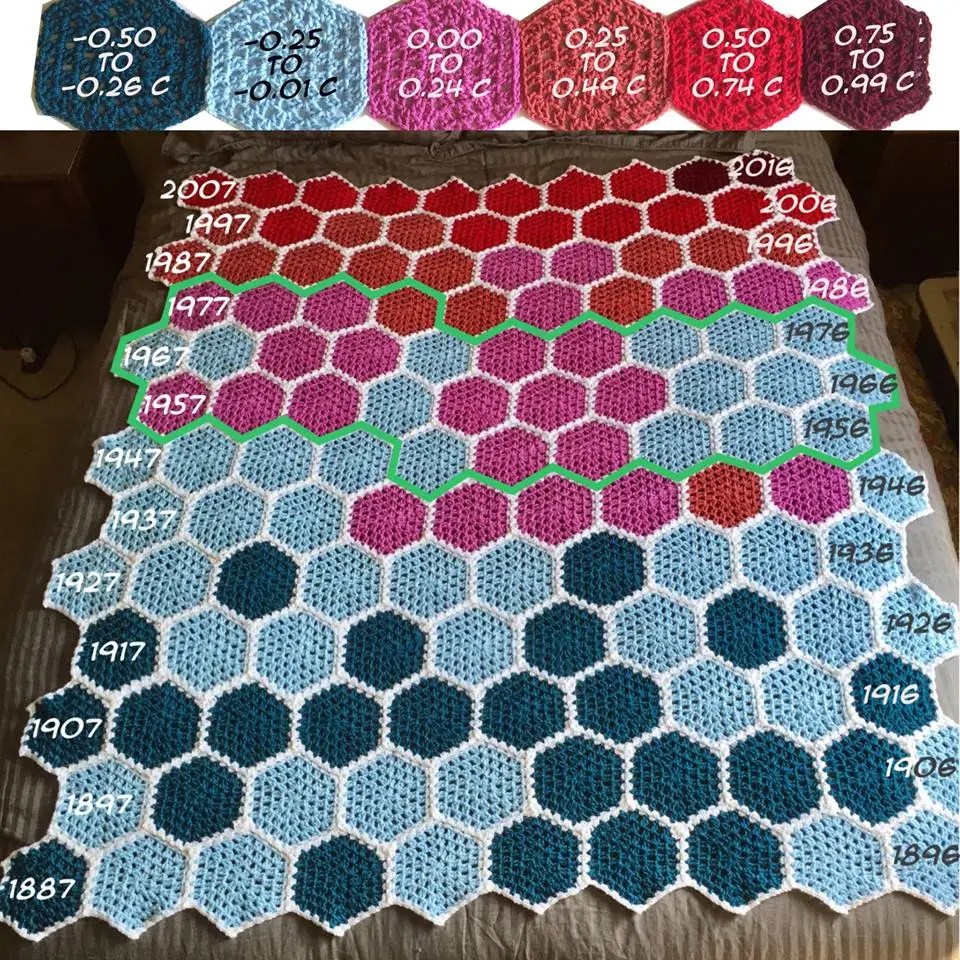
While it is beautiful, it would be challenging to understand without help due to the honeycomb pattern measuring years in a zig-zag pattern. A more efficient way to share data in the form of crochet is with rows. This approach is often used with mood blankets, as demonstrated in the video below.
Ultimately, “good” charts and data visualization are subjective. While more creative forms of expression will be more eye-catching, they are not beneficial unless they are also easy to understand.
