Category: Data Visualization
-
Dear Data

I love to read, but when someone asks me what I like to read, I often draw a blank. It feels like I read a wide range of books because I usually take recommendations from friends and family. I also generally say I like science fiction the best but realized I was unsure of the…
-
Data Visualization in Action
When data is visualized, it can tell exciting stories, but what happens when it isn’t visualized well? The visualization process starts with choosing the best format to display the data. This complex task is made even more complicated when working with geographical data because not all maps are created equal. Because the earth is a…
-
The Ultimate Data Breakdown
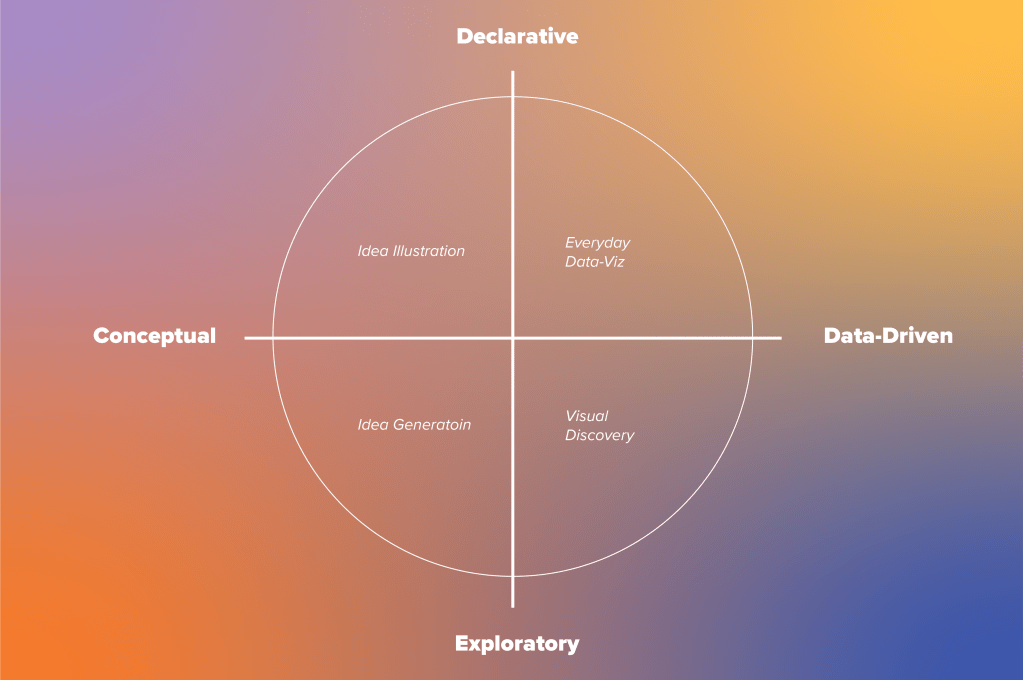
Before effectively visualizing data, it is vital to understand the different kinds and purposes. There are four broad categories: declarative, exploratory, conceptual, and data-driven. Generally, data will fall into two of the four: declarative or exploratory and conceptual or data-driven. So, what do these characteristics mean? Declarative vs. exploratory Declarative data is most frequently used…
-
An Introduction to Data Visualization
Data visualization has existed for hundreds of years. It began with maps documenting weather and elevation and has evolved into measuring almost anything you can imagine. Advances in technology let us share all kinds of information in many different ways. Everything from weather maps, like at the origin of data visualization, to graphs of COVID…
